|

AURORA
History
|
After A.D. |
- Auroras observed occasionally by Chinese,
Greek and Romans.
|
|
16th century |
- Tycho Brahe observes auroras from his observatory
at Uraniborg.
|
|
17th century |
- Pierre Gassendi observes several auroras in the early
17th century and suggests the name Aurora Borealis. Discovery
of sunspots (1609), Maunder minimum
of solar activity (1645-1715), the auroras observed only
exceptionally.
|
|
1733 |
- J. J. Dortou de Mairan suggests that
the auroral light was generated by a solar fluid impinging upon
the Earth atmosphere. First theory based on a relationship between
the Sun and the Earth.
|
|
1741 |
- Olof P. Hiorter observes perturbations of the compass
needle during the aurora phenomenon. Together with his chief Anders
Celsius discovered the magnetic basis for auroras.
|
|
1745 |
- Don Ulloa, a Spanish naval, observes a polar
light when rounding Cape Horn (56°) and confirms the hypotheses of J. Mairana
that polar lights arise in both polar regions.
|
|
1770 |
- Captain James Cook confirms the auroras in high
southern latitudes.
|
|
1775 |
- Pehr Wilhelm Wargentin concluded from various
observations that auroras are observable from different places at
the same time and extend horizontally as a belt surrounding the
North Pole.
|
|
1896 |
- Kristian Birkeland suggests that auroras were
produced by electrons ejected from the Sun and guided by the Earth
magnetosphere to the high-latitude region.
|
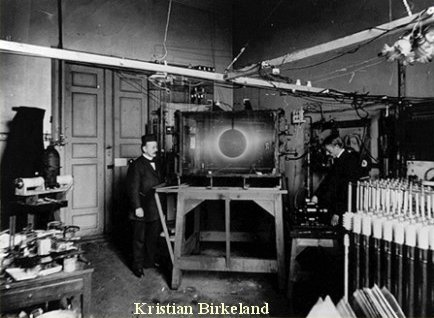
Birkeland verified his theories experimentally. He
manufactured a small Earth maquette
(terrella). It was iron magnetized ball in vacuum chamber. Birkeland
bombarded the terrella
with electrons. Most of them finished in polar regions. This experiment is
depicted on
200 crown Norwegian note. The terrella is deposited in Aurora museum in
Tromso.
|
1939 |
- Hannes Alfvén proposes first detailed model of
the aurora and magnetic storm phenomena. The current sheaths along the Earth magnetic
field are responsible for radiation of excited atmosphere
atoms.
|
|
1954 |
- Seaton and Hunten suggest classification of the
aurora intensity based on the number of photons emitted. The scale
is nowadays known as IBC (International Brightness
Coefficient).
|
|
1966 |
- Navigation satellite 1963-38C detects currents in
the upper atmosphere.
|
|
1973 |
- Satellite TRIAD measures the currents along Earth
magnetic field lines in detail. The maximum of the currents is near
70° latitude. The currents form vertical walls of both directions.
|
Triad satellite: White are currents into the
ionosphere, crosshatched
are currents
away
from the ionosphere. These measurements
served
as the basis
for the expedition logo.
|
1974 |
- The A. Vallance-Jones classification of the
aurora shapes had been established (HA, HB, RA, RB, DS, PS, PA, PC, F).
|
|
1981 |
- Satellite DYNAMICS EXPLORER I for the first time
observes the whole aurora oval.
|
|
1989 |
- On the March 13th reached the Earth a
cloud of charged particles from the Sun. Rapid changes in magnetic
field induced electrical voltage which completely destroyed main
Quebec transformer. Total collapse of the electrical network
involved Canada, Ontario and British Columbia. Local failures were
in Pennsylvania, New York and even California. Fantastic Northern
Lights twinkled above darkled America.
|
1990
--> |
- Auroras had been observed on Saturn and Jupiter (HST,
STIS). Intense investigation of the auroras from space begins (POLAR, DYNAMICS EXPLORER I, NOAA).
Auroras of the same type correspond at the same time in both Earth
polar regions.
|
|
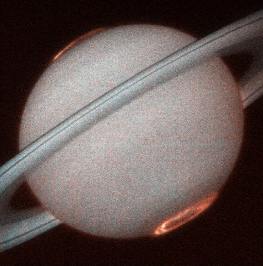
Saturn Aurora, UV region. HST, STIS, 1998. |
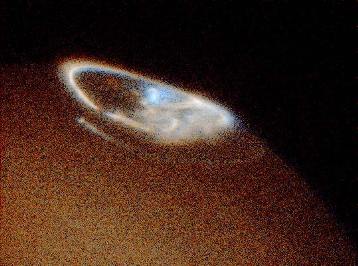
Jupiter Aurora, north pole. HST,
STIS. |
Aurora classifications Polar lights (Aurora Polaris) are divided as Northern Lights
(Aurora Borealis) and Southern Lights (Aurora Australis).
-
The
classification of the auroras from the intensity point of view was
introduces by Seaton a Hunten in
1954 (the intensity unit is 1 R - Rayleigh, 106 fotons
reaching 1 cm2 during 1 s). The resulting
coefficient IBC (International Brightness Coefficient) can acquire
the values from I to IV.
-
The classification of the auroras
from the shape point of view was introduced by Valance and
Jones in 1974. The classification includes nine basic shapes.
Seaton Hunten classification
| IBC |
Intensity (R) |
Equivalent
source |
| I |
103 |
Milky Way |
| II |
104 |
Thin moonlit cirrus clouds |
| III |
105 |
Moonlit cumulus clouds |
| IV |
106 |
Full moonlight |
Valance-Jones classification
| Shape |
Name |
Explanation |
| HA |
Homogeneous Arc |
Regular form in height, direction and intensity. |
| HB |
Homogeneous Band |
Same as HA, but variable along length. |
| RA |
Rays Arc |
Same as HA, luminosity quasi vertically
structured. |
| RB |
Rays Band |
Same as RA, luminosity quasi vertically
structured. |
| DS |
Diffuse Surface |
Uniform emitting area. |
| PS |
Pulsating Surface |
Same as DS, but intensity variable in time
(several seconds). |
| PA |
Pulsating Arc |
Same as HA, but intensity variable in time
(several seconds). |
| C |
Corona |
Ray system parallel to the magnetic field lines. |
| F |
Flaming |
Forms of variable intensity moving towards
zenith. |
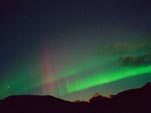 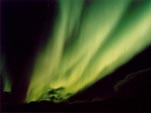  
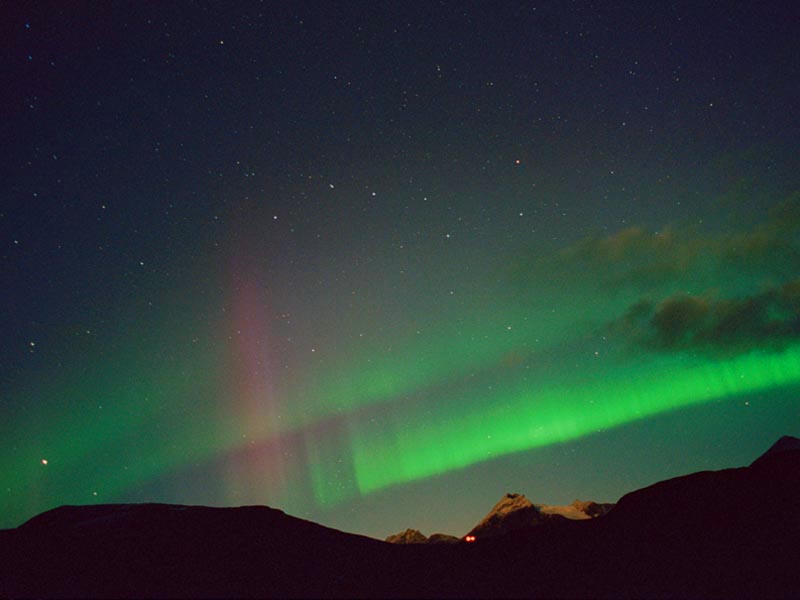
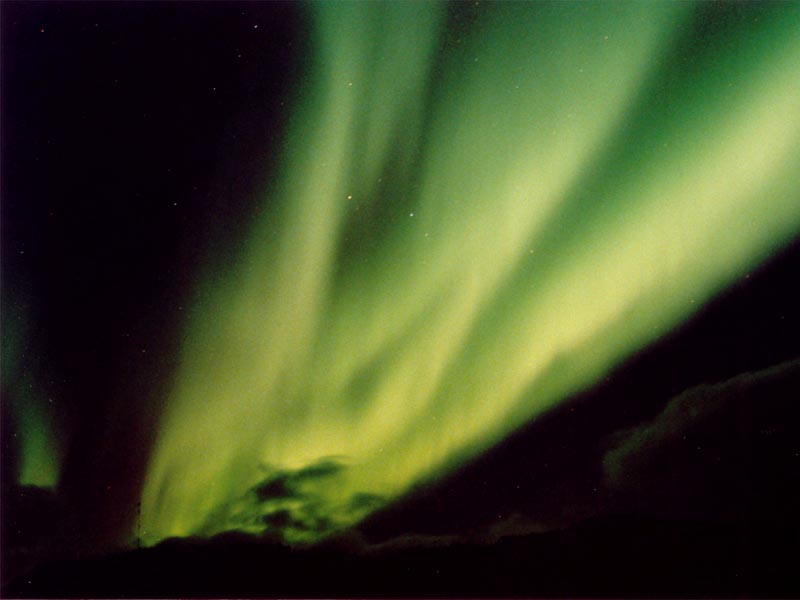
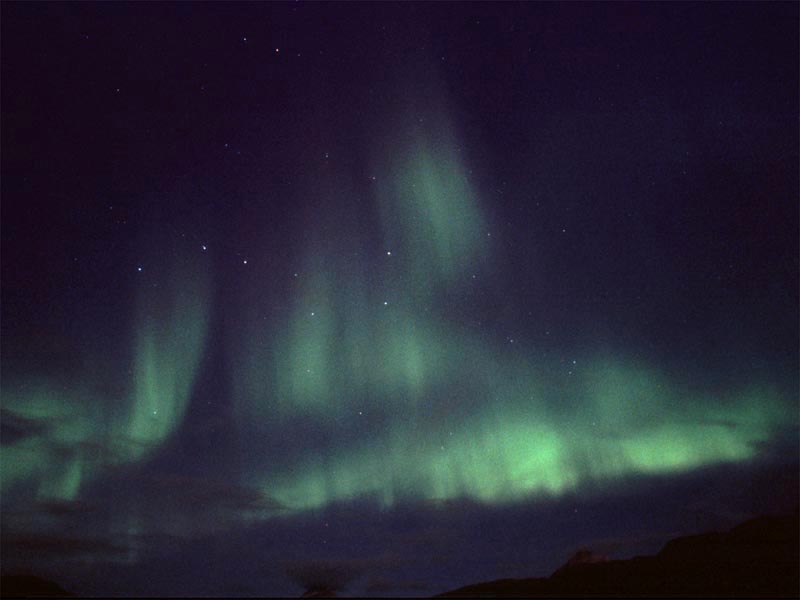
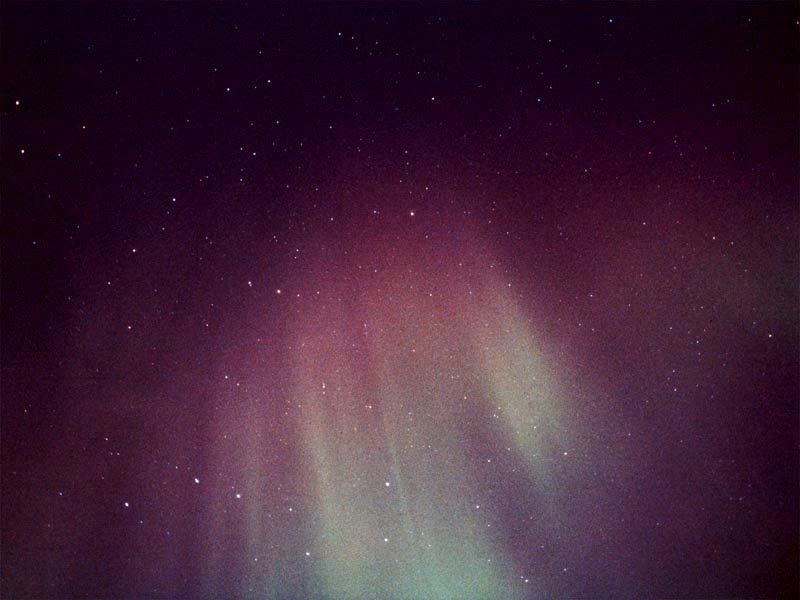
Some of our photographs. Try to class
them.
-
Other classification represents Kp index and from it
derived
activity NOAA index. Both indices are proportional to magnetic
field fluctuations from the equilibrium state and the lower
geomagnetic latitude limit for possible aurora observation. The
geomagnetic pole is shifted with respect to the geographic one towards
America and Canada. Prague geomagnetic latitude is 45,5° and so the
highest activity degree has to be reached for aurora observations in
Prague.
|
Kp index |
Lower geomagnetic
latitude limit |
index NOAA |
Lower geomagnetic
latitude limit |
| 0 |
66,5 |
1 |
67,5 |
| 1 |
64,5 |
2 |
66,5 |
| 2 |
62,4 |
3 |
65,6 |
| 3 |
60,4 |
4 |
63,9 |
| 4 |
58,3 |
5 |
62,5 |
| 5 |
56,3 |
6 |
60,7 |
| 6 |
54,2 |
7 |
58,6 |
| 7 |
52,2 |
8 |
56,7 |
| 8 |
50,1 |
9 |
54,6 |
| 9 |
48,1 |
10 |
51,0 |
| - |
- |
10+ |
48,5 |
| - |
- |
10++ |
45,0 |
The aurora occurrence Polar lights are known from polar regions of both
hemispheres. So called auroral oval is formed near the 70°latitude, the
thickness can be 5°. The oval is best visible in UV region from the cosmic
space. The auroral oval can be deformed in various ways. Its
intensity depends on the solar activity. During increased solar activity
marvellous polar lights with rich internal structure arise in the vicinity
of the oval. Sporadically the polar lights arise in the areas out of the
oval, but they have relatively simple structure. From the physical point
of view the oval is a region of electric currents flowing along the Earth
magnetic field lines. In the right figure you can see the aurora oval in
UV region photographed by the POLAR satellite in 1997.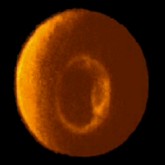 Polar
lights are located in the heights from 70 to 300 km above the Earth.
The visually observed polar lights are the most-down parts of the current
sheaths. The length (horizontal) can reach up to 1000 km. The light
wall thickness is several kilometres, maximally about 10 kilometres.
The characteristic time of the polar light evolution can be
in minutes, for pulsating surfaces in seconds. Sometimes it is possible to
watch light waves in the aurora and moving vertical columns.
The characteristic colours are green (oxygen), red (oxygen,
hydrogen) and blue (molecular nitrogen). The oxygen also radiates in UV
region, where the satellite observations are performed.
 Physical
mechanisms Physical
mechanisms The Sun is a star with variable activity. Both charged and neutral
particles move through the Solar System in solar wind. These particles
interact with the Earth magnetosphere. Electrons and ions rotate along
magnetic field lines (so called gyration motion). The characteristic
gyration radius is 200 m for ions and 10 cm for electrons. The protons can
catch electron and become a neutral hydrogen atom which does not interact
with the Earth magnetic field. In
auroral region the electric discharge evolves, the current sheaths have
typical current density about 30 µA/m2.
There are three typical phenomena from the microscopic point of view:
Microscopic mechanisms
Direct excitation.
Magnetosphere electrons collide with atoms and molecules of the
atmosphere and excite the surrounding bounded electrons:
X + e —> X * + e.
During subsequent deexcitation the light of some typical wavelength is
emitted:
X * —> X + g.
In dense atmosphere near the Earth surface there is not sufficient time
for the deexcitation process. The energy is quenched during collisions
to other species. That is why the auroras are observed from 70 km above. Indirect excitation.
There is a great number of indirect excitation processes due to the
collisions. Let us mention dissociative recombination of oxygen molecule
as an example: O2+ + e —> O* + O.
As the next step deexcitation of the oxygen atom occurs: O * —> O + g. Proton collisions. The proton collisions ca
ionize hydrogen (lost of the hydrogen electron), ionize molecules or
dissociate molecules. Polar lights caused by protons are low intensive
(type I) and mostly without internal structure (HA, DS).
All these processes are responsible for the light effects
connected with auroras. Various deexcitation processes in atoms of oxygen
and nitrogen cause mostly green, red and blue auroras. The colour depends
on the atmosphere state and on the height above the Earth. Exceptionally
yellow auroras can be observed in places where red and green auroras
overlap. The most common green colour is caused by the emission line
557.7 nm of the oxygen O(1S).
Typical aurora spectral lines
|